
Geoff Blount, CEO of Cannon Asset Managers, looks deeper into the performance of the JSE in 2013.

How do you explain to your children that, in spite of an overall drop in earnings per share on the JSE of 6.4% in 2013, prices rose by 17.8%?
This strange situation, as illustrated in Chart 1, masks a great underlying discrepancy in performance that took place last year.
Chart 2 below teases out the divergence in returns and earnings growth between the JSE Top 40 shares and small-cap stocks.
Price Earnings (PE) ratios for large cap shares (the Top 40 that makes up 85% of the JSE) rose nearly 24%, despite their earnings falling 8% in 2013, implying that the market (ie investors) has made them much more expensive relative to their declining earnings base.
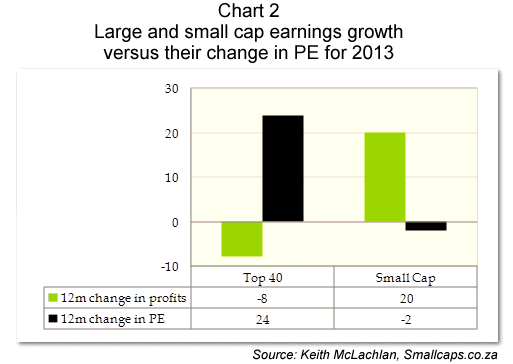
But amazingly, small-cap shares grew their earnings by 20% yet investors marked them down, pushing their PEs 2% lower. We have spoken in the past about small caps being the elephant in the room that investors seem to be missing, and here it is again.
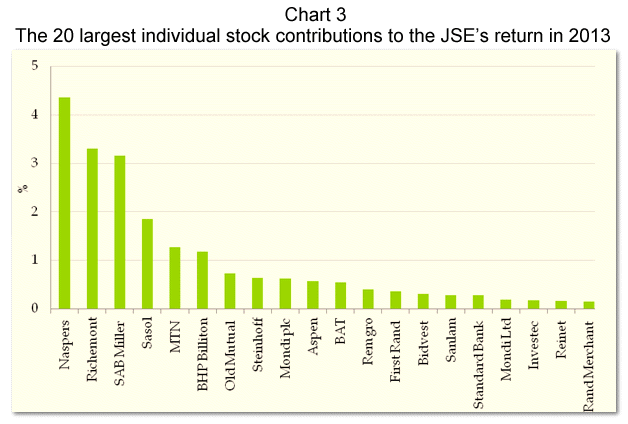
We have also spoken about the JSE’s top performing stocks and we have updated this to the end of 2013, as shown in Chart 3. A staggering 11% of last year’s 18% market rise was from Naspers, Richemont and SAB Miller. If you owned all other 157 companies that make up the index, your return was just 7%!
Click to enlarge
Another interesting observation that we can make about the JSE in 2013 is that 60% of the shares underperformed the All Share Index. Within this group, the Cyclically Adjusted Price Earnings (CAPE) ratio fell marginally through the year from 15.9x to 15.3x (which represents reasonable value) yet the CAPE ratio for the 40% of share which underperformed the JSE, the average CAPE rose from an already expensive 19x to a very expensive 25x.
Table 1: JSE metrics of under- and out-performing segments
|
60% which underperformed the All Share Index |
40% which outperformed the All Share Index |
|
| CAPE ratio |
From 15.9x to 15.3x |
From 19x to 25x |
| Average price to book |
2.5x |
3.3x |
| Average Return on Equity (profits/balance sheet capital) |
13% |
16% |
We can also see from Table 1 that the average price to book ratio for the outperforming stocks was 3.3x, significantly above the 2.5x of underperforming stocks. Although shares that outperformed the market last year do enjoy slightly higher ROEs (16% versus 13%), and should therefore have some valuation premium, we do not believe that they warrant a CAPE of 25x versus 15x.
Conclusions
We can draw some conclusions from this. While the JSE in aggregate did well last year, this was driven by, in particular, a narrow band of expensive (but typically good quality) large-cap industrials that got more expensive. These areas of the market represent investment risk, and investors should be cautious here. And while the sexy stocks grabbed all the headlines, the index rise masked many amazing opportunities that have been created elsewhere in the market, including smaller cap shares.
This is not the time to sell out of South African equities. Just be very careful which of them you own.
Cannon Asset Managers is a niche investment management company that applies the philosophy and principles of value investing.






0 Comments